Scales Library
scales
Allows display data in a graduated level
Author(s): Jose David M.
Implementation Notes
Scales version in CircuitPython
- class scales.Axes(*args: Any, **kwargs: Any)
- Parameters:
x (int) – pixel position. Defaults to
0y (int) – pixel position. Defaults to
0limits (int,int) – tuple of value range for the scale. Defaults to (0, 100)
ticks (list) – list to ticks to display. If this is not enter a equally spaced scale will be created between the given limits.
direction (str) – direction of the scale either
horizontalorverticaldefaults tohorizontalstroke (int) – width in pixels of the scale axes. Defaults to
3length (int) – scale length in pixels. Defaults to
100color (int) – 24-bit hex value axes line color, Defaults to Purple
0x990099
- class scales.Scale(*args: Any, **kwargs: Any)
- Parameters:
x (int) – pixel position. Defaults to
0y (int) – pixel position. Defaults to
0direction (str) – direction of the scale either
horizontalorverticaldefaults tohorizontalstroke (int) – width in pixels of the axes line. Defaults to
3pixelslength (int) – scale length in pixels. Defaults to
100pixelscolor (int) – 24-bit hex value axes line color, Defaults to Purple
0x990099width (int) – scale width in pixels. Defaults to
50pixelslimits – tuple of value range for the scale. Defaults to
(0, 100)ticks (list) – list to ticks to display. If this is not enter a equally spaced scale will be created between the given limits.
back_color (int) – 24-bit hex value axes line color. Defaults to Light Blue
0x9FFFFFtick_length (int) – Scale tick length in pixels. Defaults to
10tick_stroke (int) – Scale tick width in pixels. Defaults to
4pointer_length (int) – length in pixels for the point. Defaults to
20pixelspointer_stroke (int) – pointer thickness in pixels. Defaults to
6pixels
Quickstart: Importing and using Scales
Here is one way of importing the
Scaleclass, so you can use it as the namemy_scale:from scale import Scale
Now you can create a vertical Scale at pixel position x=50, y=180 and a range of 0 to 80 using:
my_scale = Scale(x=50, y=180, direction="vertical", limits=(0, 80))
Once you setup your display, you can now add
my_scaleto your display using:display.show(my_scale)
If you want to have multiple display elements, you can create a group and then append the scale and the other elements to the group. Then, you can add the full group to the display as in this example:
my_scale= Scale(x=20, y=30)
my_group = displayio.Group() # make a group
my_group.append(my_scale) # Add my_slider to the group

#
# Append other display elements to the group
#

display.show(my_group) # add the group to the display
Summary: Slider Features and input variables
The
Scaleclass has some options for controlling its position, visible appearance, and value through a collection of input variables:position:
x`,ysize:
lengthandwidthcolor:
color,back_colorlinewidths:
strokeandtick_strokerange:
limits
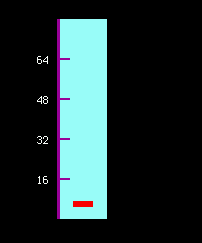
Diagram showing a simple scale.
- animate_pointer(new_value)
Public function to animate the pointer
- Parameters:
new_value – value to draw the pointer
- Returns:
None
- scales.rectangle_draw(x0: int, y0: int, height: int, width: int, palette)
rectangle_draw function
Draws a rectangle using or
vectorio.Rectangle